
Metrics and alerts
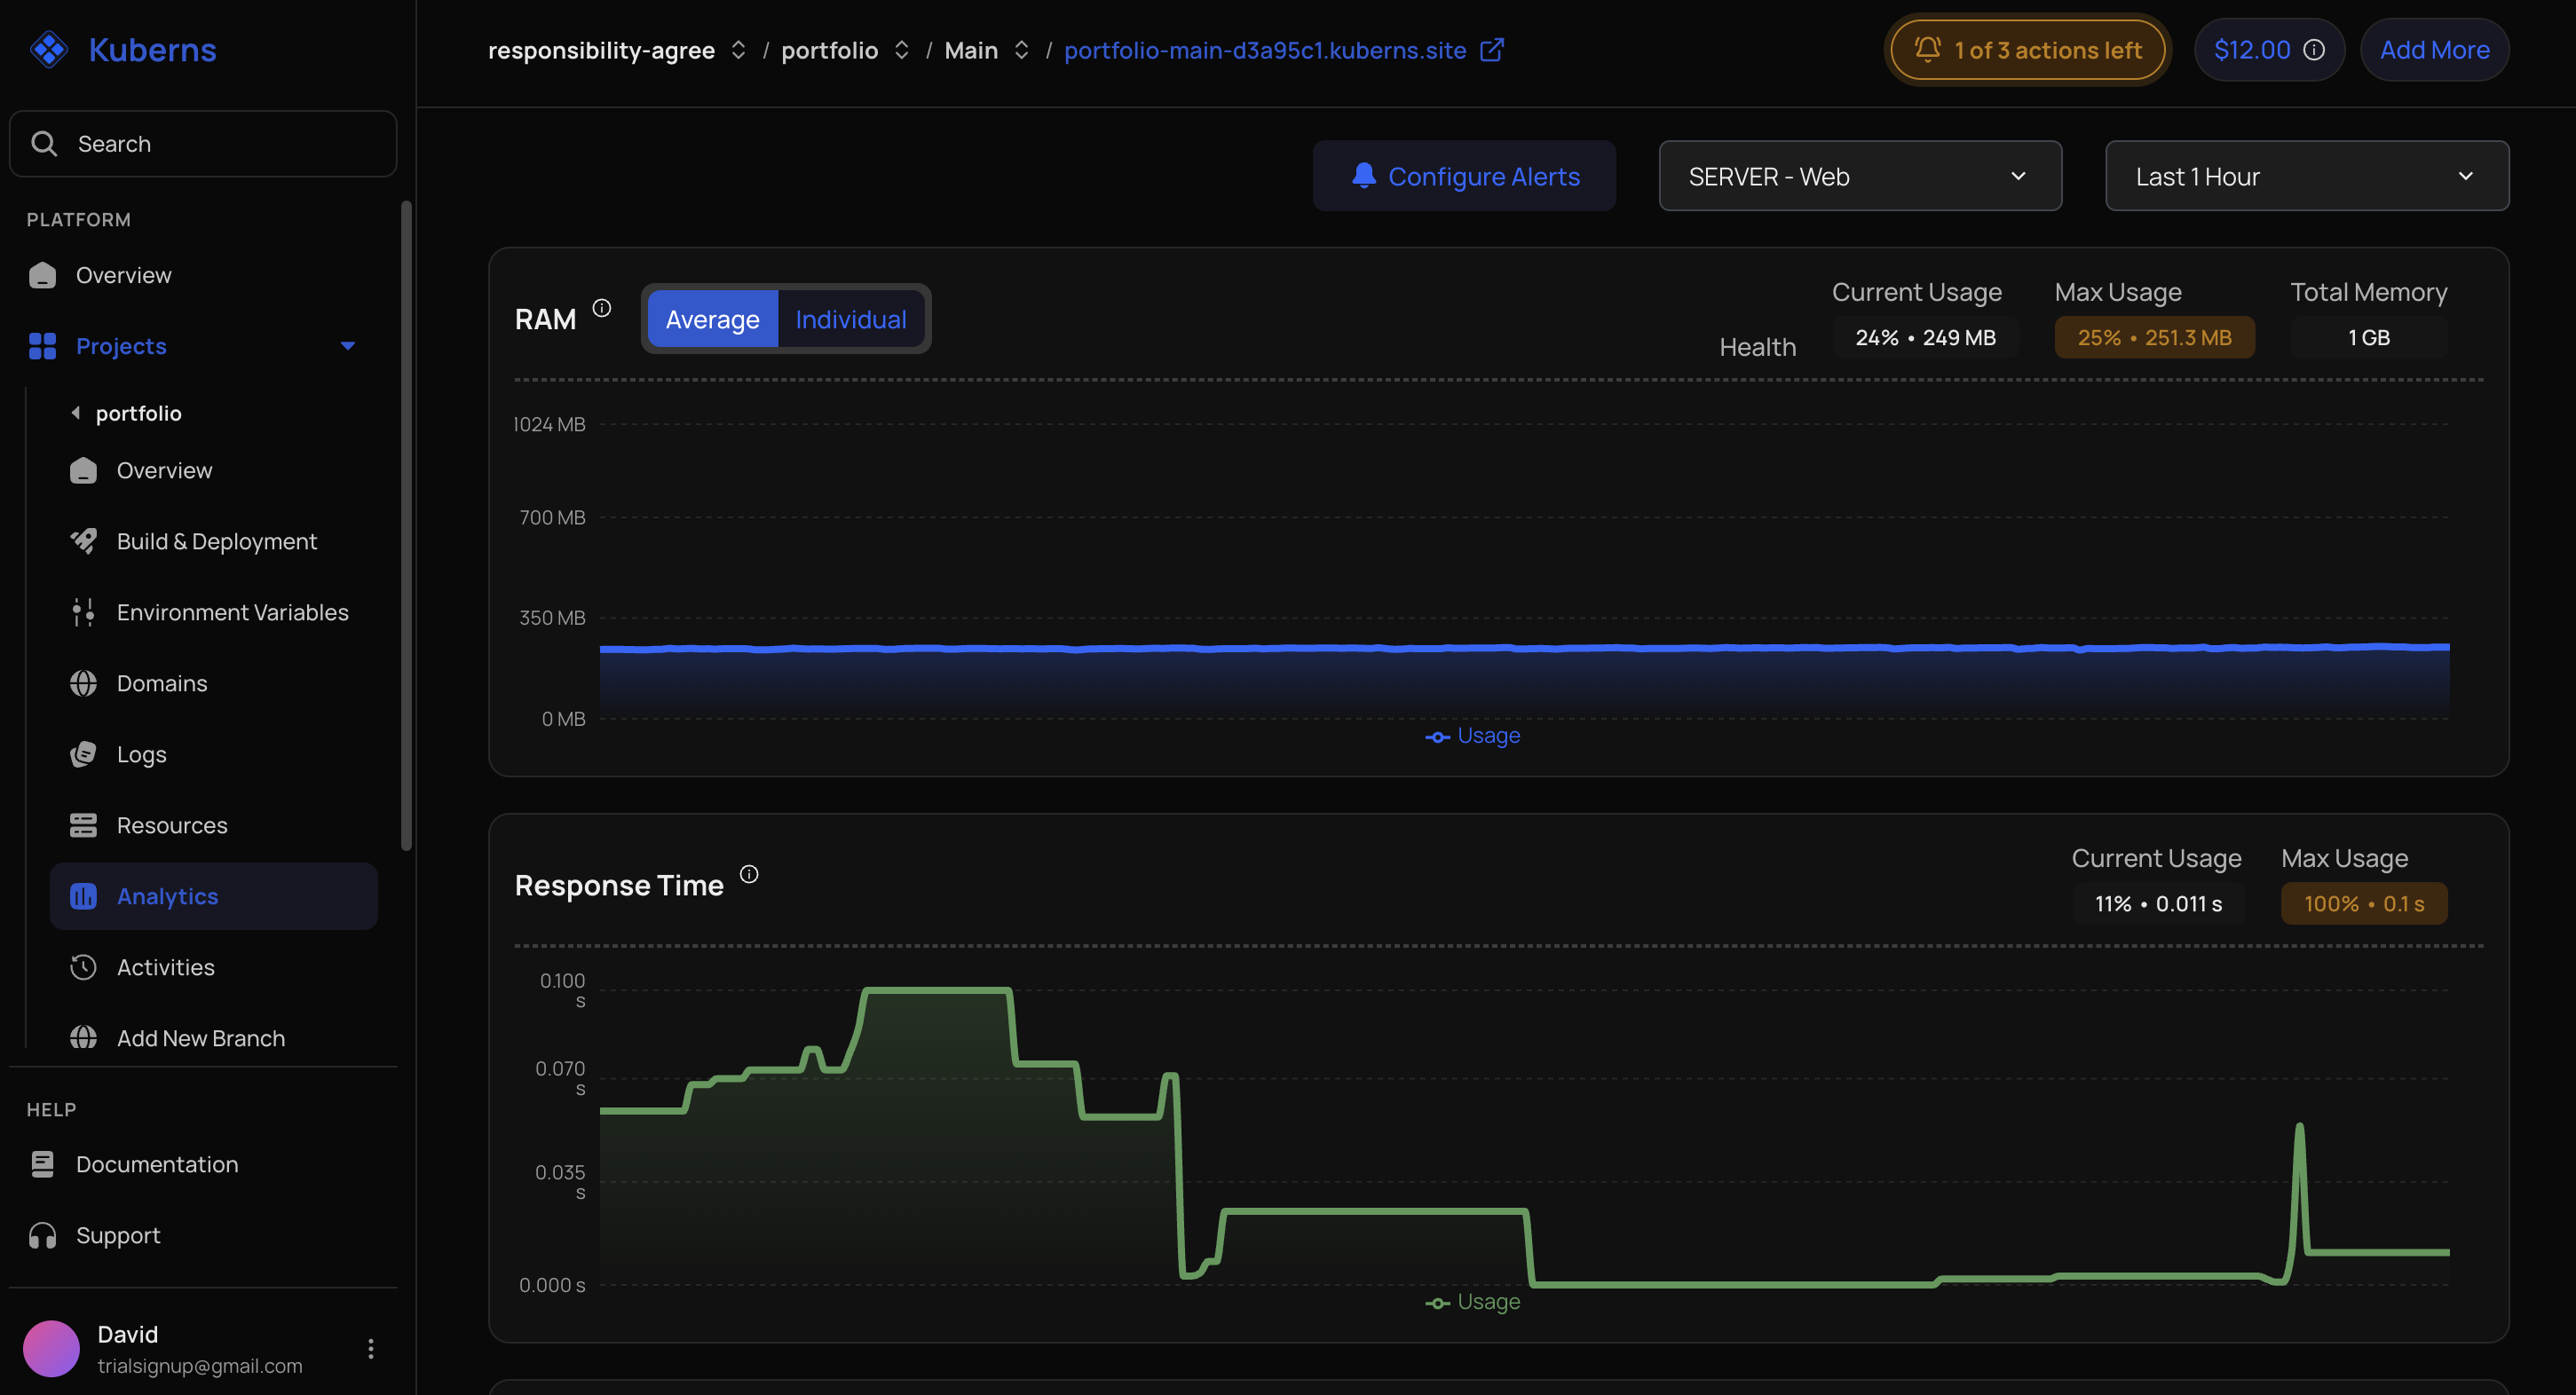
Open Analytics / Metrics for the selected environment.
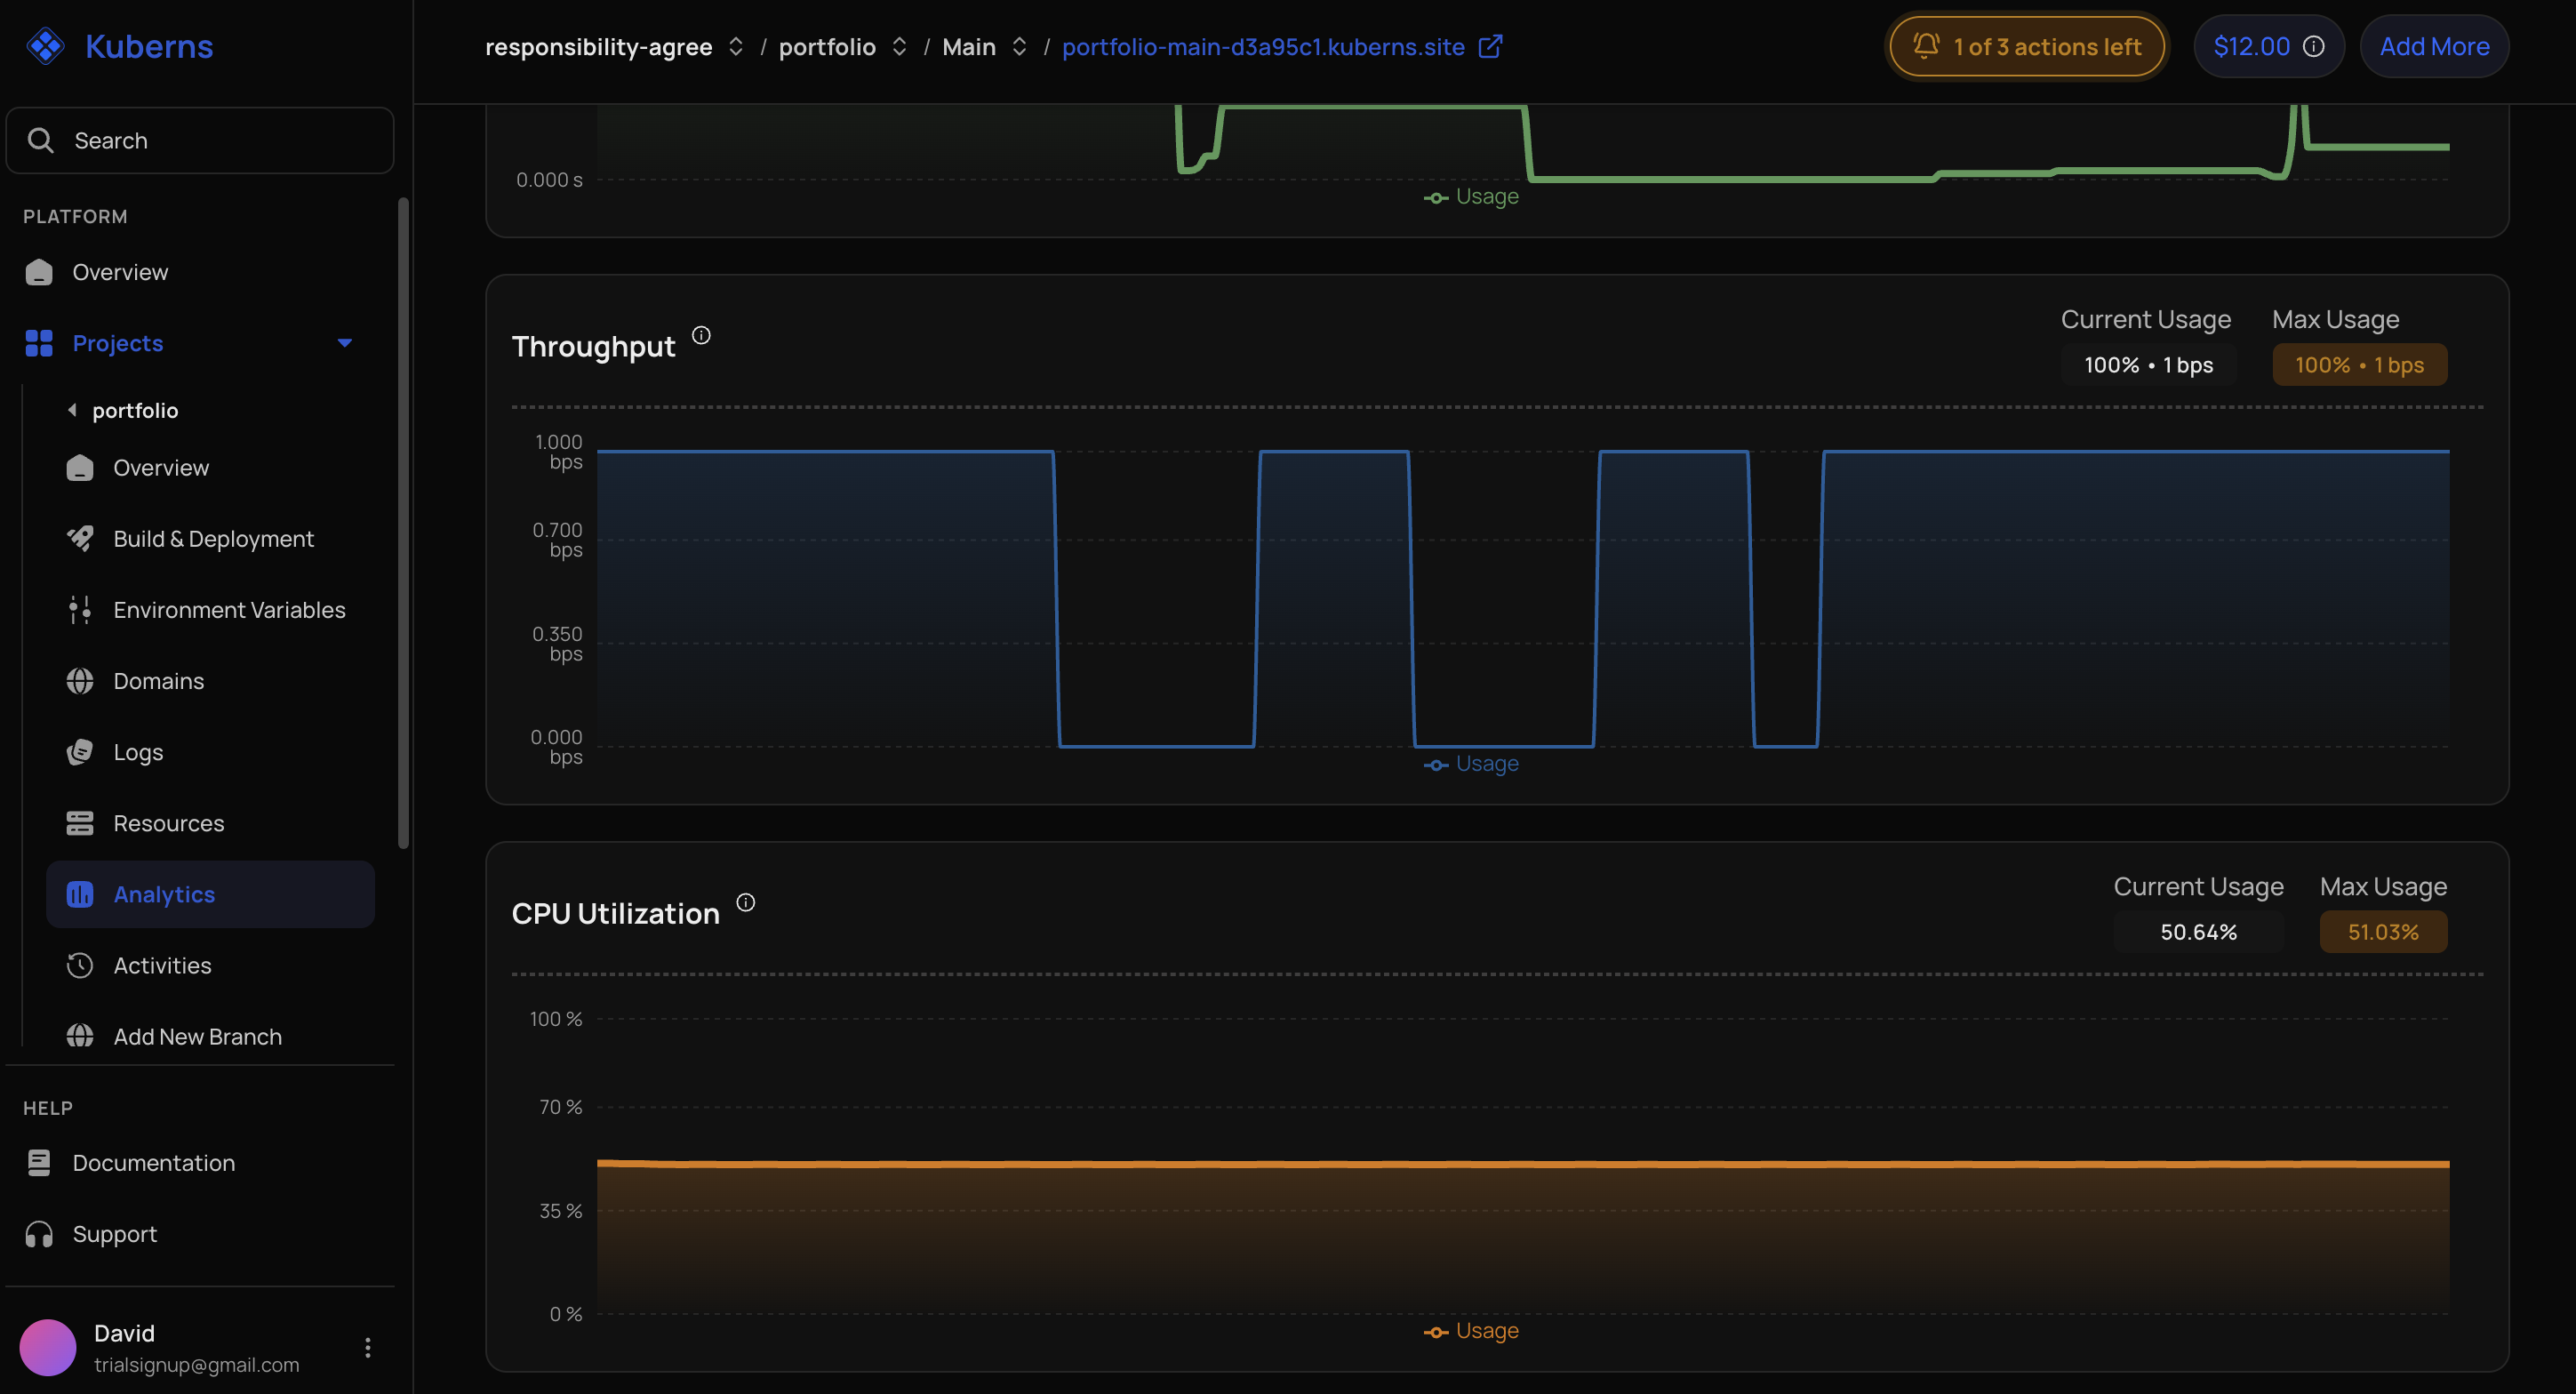
Available dashboard metrics include:
- CPU usage.
- RAM or memory usage.
- Response time.
- Throughput.
Use the environment, resource, and time controls shown by the current dashboard to narrow the data.
Configure alerts
Alert configuration is available for eligible accounts and resources. Trial accounts can be restricted from creating or changing alerts.
When creating a rule:
- Select the metric and target resource.
- Choose the threshold and evaluation settings available in the dashboard.
- Save the alert.
- Confirm that the account's notification details are current.
Metrics indicate symptoms. Use service logs, build logs, activities, and resource state to find the cause.