Metrics Overview
In Kuberns, monitoring the performance and health of your services is crucial. The Metrics page provides detailed insights into four major metrics for each service within your project: Build Activity, RAM, Throughput, and Response Time. Understanding these metrics can help you optimize your services and ensure they are running efficiently.
Build Activity
Definition: Build Activity refers to the frequency and status of builds for your service. It includes details such as the number of successful builds, failed builds, and the duration of each build.
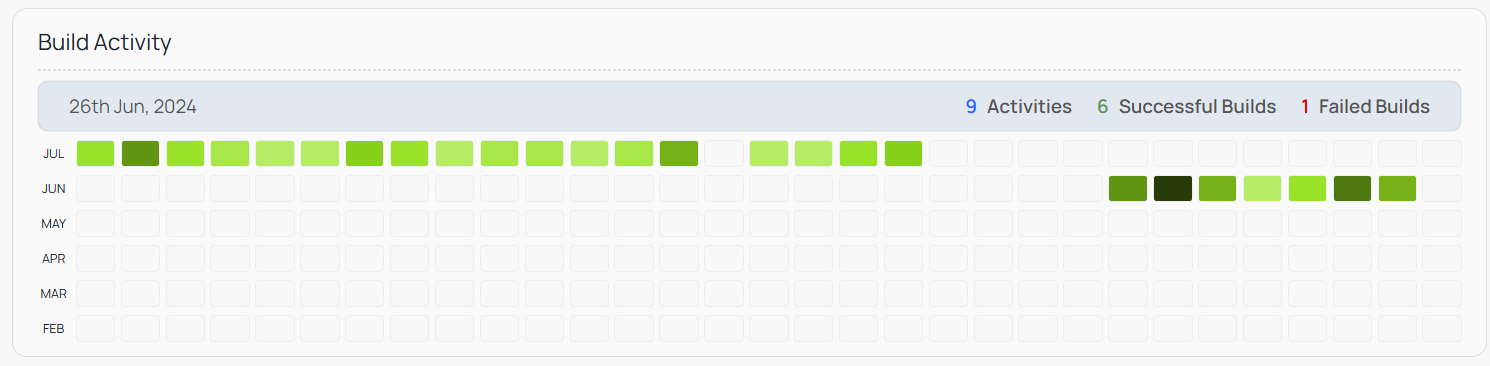
You can view each day's build data by selecting the particular cell on the Metrics page. This allows for a more detailed analysis of daily build activities and trends.
How to make use of this information
- Monitoring Build Success: By tracking successful and failed builds, you can quickly identify issues in your codebase and take corrective actions.
- Build Duration: Analyzing the time taken for each build helps in optimizing the build process. Long build times can indicate inefficiencies in your code or the build configuration.
- Trends Over Time: Observing trends in build activity over time can help in understanding how changes to the codebase affect the build process and stability.
RAM (Memory Usage)
Definition: RAM usage indicates the amount of memory consumed by your service during its operation. It provides insights into the memory allocation and consumption patterns.
How to make use of this information
- Resource Allocation: Monitoring RAM usage helps in ensuring that your service has sufficient memory allocated for optimal performance.
- Detecting Memory Leaks: Sudden spikes or continuous increases in memory usage can indicate memory leaks or inefficient memory management in your code.
- Scaling Decisions: Understanding memory usage patterns allows you to make informed decisions about scaling your services to handle increased load.
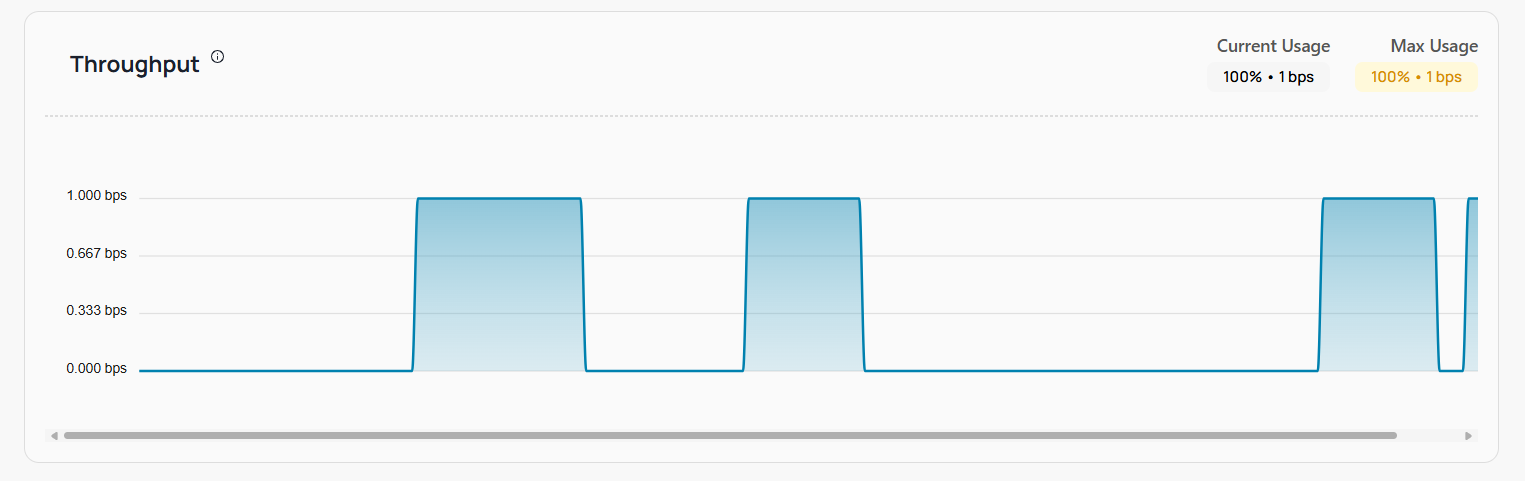
Throughput
Definition: Throughput measures the number of requests processed by your service in a given period. It reflects the capacity and efficiency of your service in handling incoming traffic.
How to make use of this information
- Service Capacity: High throughput indicates that your service can handle a large volume of requests efficiently. Monitoring this metric helps in assessing the capacity of your service.
- Load Management: Identifying periods of high throughput can help in managing and balancing the load across multiple services or instances.
- Performance Bottlenecks: A drop in throughput might signal performance bottlenecks or issues within the service that need to be addressed.
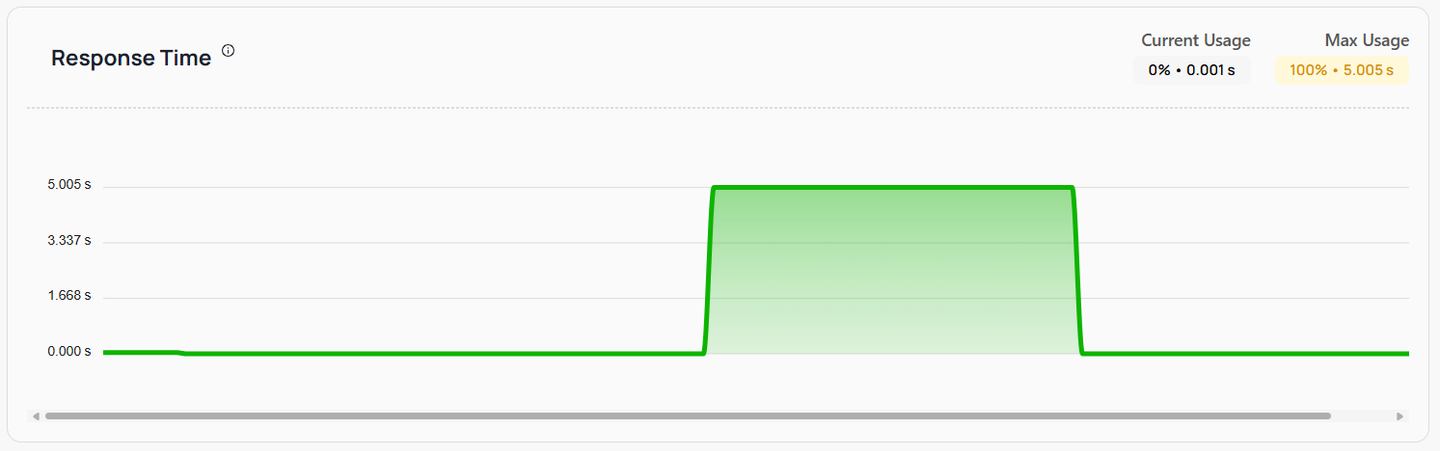
Response Time
Definition: Response Time is the duration it takes for your service to respond to a request. It is a critical metric for assessing the performance and user experience of your service.
How to make use of this information
- User Experience: Lower response times contribute to a better user experience. Monitoring this metric helps ensure that your service responds quickly to user requests.
- Identifying Latency Issues: High response times can indicate latency issues within the service or its dependencies. Analyzing this metric helps in pinpointing and resolving such issues.
- Optimization Opportunities: Consistently high response times can highlight areas where optimization is needed, whether in the code, database queries, or network configurations.
By regularly monitoring these metrics, you can gain valuable insights into the performance and health of your services. This enables you to make informed decisions about optimizations, scaling, and troubleshooting, ensuring that your services run smoothly and efficiently.
Filter Options for Metrics
Kuberns provides a common filter option for the RAM, Throughput, and Response Time metrics to help users customize their view and gain more precise insights. These filter options, as shown in the image, include the ability to configure alerts, select a specific server, and choose a time range for the displayed data.
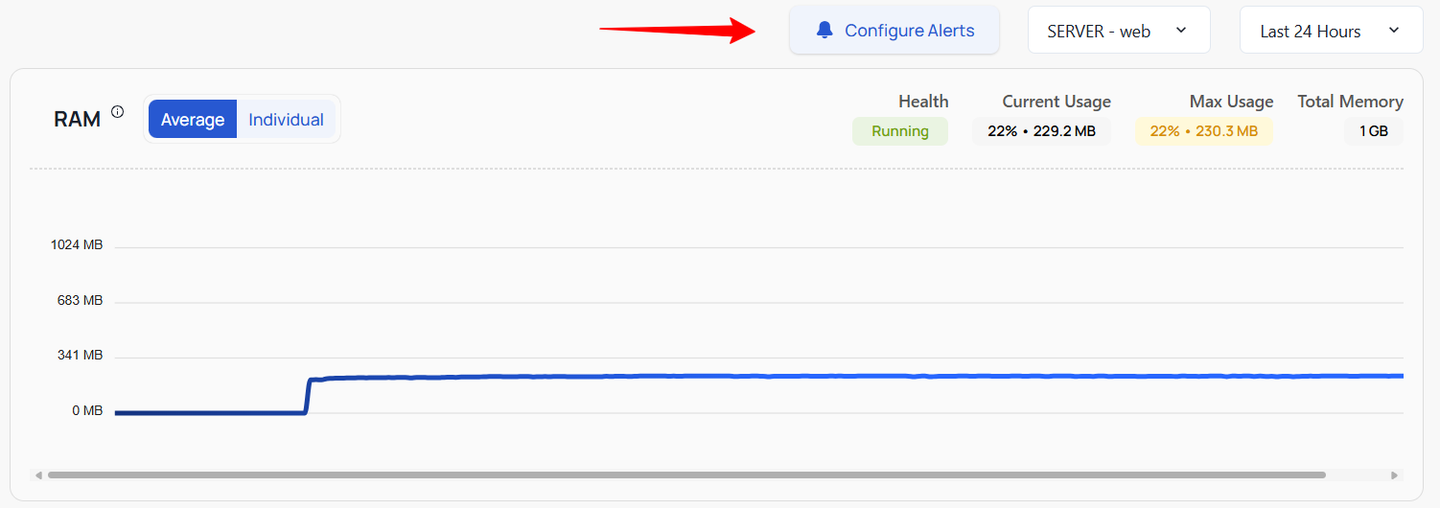
Explanation of Filter Options:
- Configure Alerts: This option allows users to set up alerts for different metrics. By configuring alerts, you can receive notifications when a specific metric exceeds or falls below a predefined threshold, enabling proactive management of your services. Detailed instructions on how to configure alerts will be provided in the next section of this documentation.
- Server Selection: Users can select a specific server from the dropdown menu to view metrics related to that server. This helps in isolating and analyzing data for individual servers within a project, making it easier to identify issues and optimize performance at a granular level.
- Time Range Selection: The time range filter allows users to choose a specific period (e.g., Last 24 Hours) for which they want to view the metrics data. This helps in focusing on recent performance or historical trends, depending on the selected time frame.
By utilizing these filter options, users can customize the metrics view to better understand and manage the performance of their services, ensuring that they have the necessary information to make informed decisions. Remember, configuring alerts is a powerful feature that will be explained in detail in the upcoming section, so stay tuned for more information.
Configuring Alerts
In Kuberns, configuring alerts is a crucial feature that helps you stay informed about the performance and health of your services. By setting up alerts, you can receive timely notifications when specific metrics exceed or fall below predefined thresholds, enabling you to take immediate action to resolve issues and maintain optimal service performance.
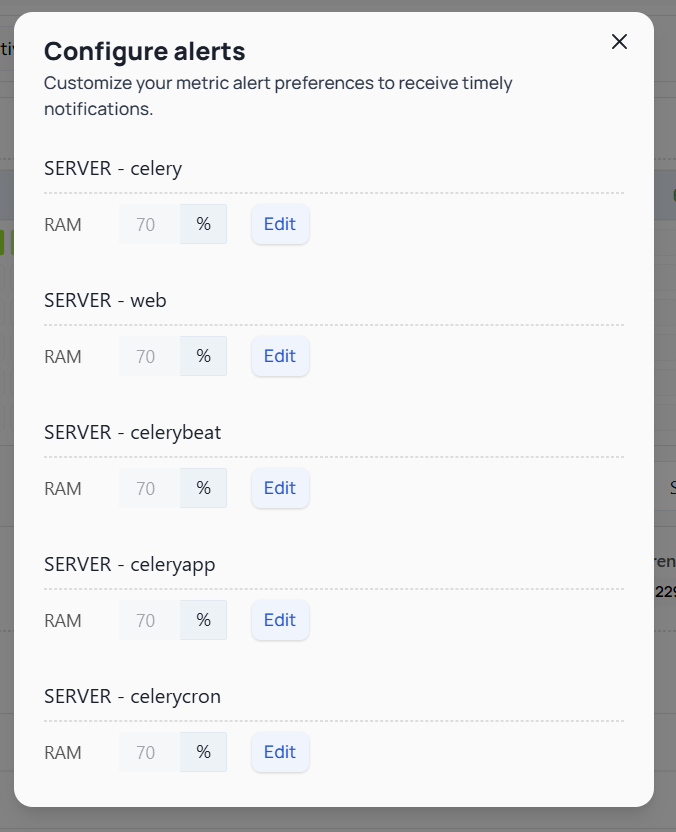
The contents on your screen may differ based on the number of servers you have in your service. Each server's metrics and alert configurations will be listed individually, so the options and fields you see might vary accordingly.
Why Use Alerts?
Alerts are essential for proactive service management. They help you:
- Stay Informed: Receive real-time notifications about critical changes in your service metrics.
- Quickly Respond to Issues: Immediate alerts allow you to address issues before they impact your users or cause significant downtime.
- Optimize Performance: By monitoring key metrics, you can identify performance bottlenecks and optimize resource usage.
How to Configure Alerts
-
On the Metrics page, click on the "Configure Alerts" button. This will take you to the Alerts Configuration section where you can set up your preferences.
-
Select the Metric and Server:
- You will see a list of metrics (e.g., RAM, Throughput, Response Time) and the associated servers.
- For each server and metric, you can specify the threshold values that will trigger an alert.
-
Set Threshold Values:
- For each combination of server and metric, you can set a specific threshold.
- To set or edit a threshold, click on the "Edit" button next to the server and metric. Enter the desired value and save your changes.
-
Save your changes to activate the alerts.
Best Practices for Alerts:
- Set Meaningful Thresholds: Ensure that your threshold values are set to meaningful levels that truly indicate potential issues.
- Avoid Alert Fatigue: Be mindful not to set thresholds too low or too high, which can lead to unnecessary alerts or missed critical notifications.
- Regularly Review Alerts: Periodically review and adjust your alert settings based on the evolving needs of your services.
By effectively configuring and managing alerts, you can ensure that you are always aware of your services' performance and can act swiftly to maintain optimal operation.