Logs in Kuberns
Kuberns provides real-time access to your application's logs, enabling you to monitor, debug, and maintain the health of your services during and after deployment.
The Logs section in the Kuberns Dashboard offers a comprehensive view of log data, with features like filtering to help you quickly identify and resolve issues.
This document explains how to access and utilize logs effectively to ensure your application runs smoothly.
Accessing Logs in Kuberns
Logs in Kuberns are available both during the deployment process and after your application is live.
You can access them through the Logs section in the Kuberns Dashboard.
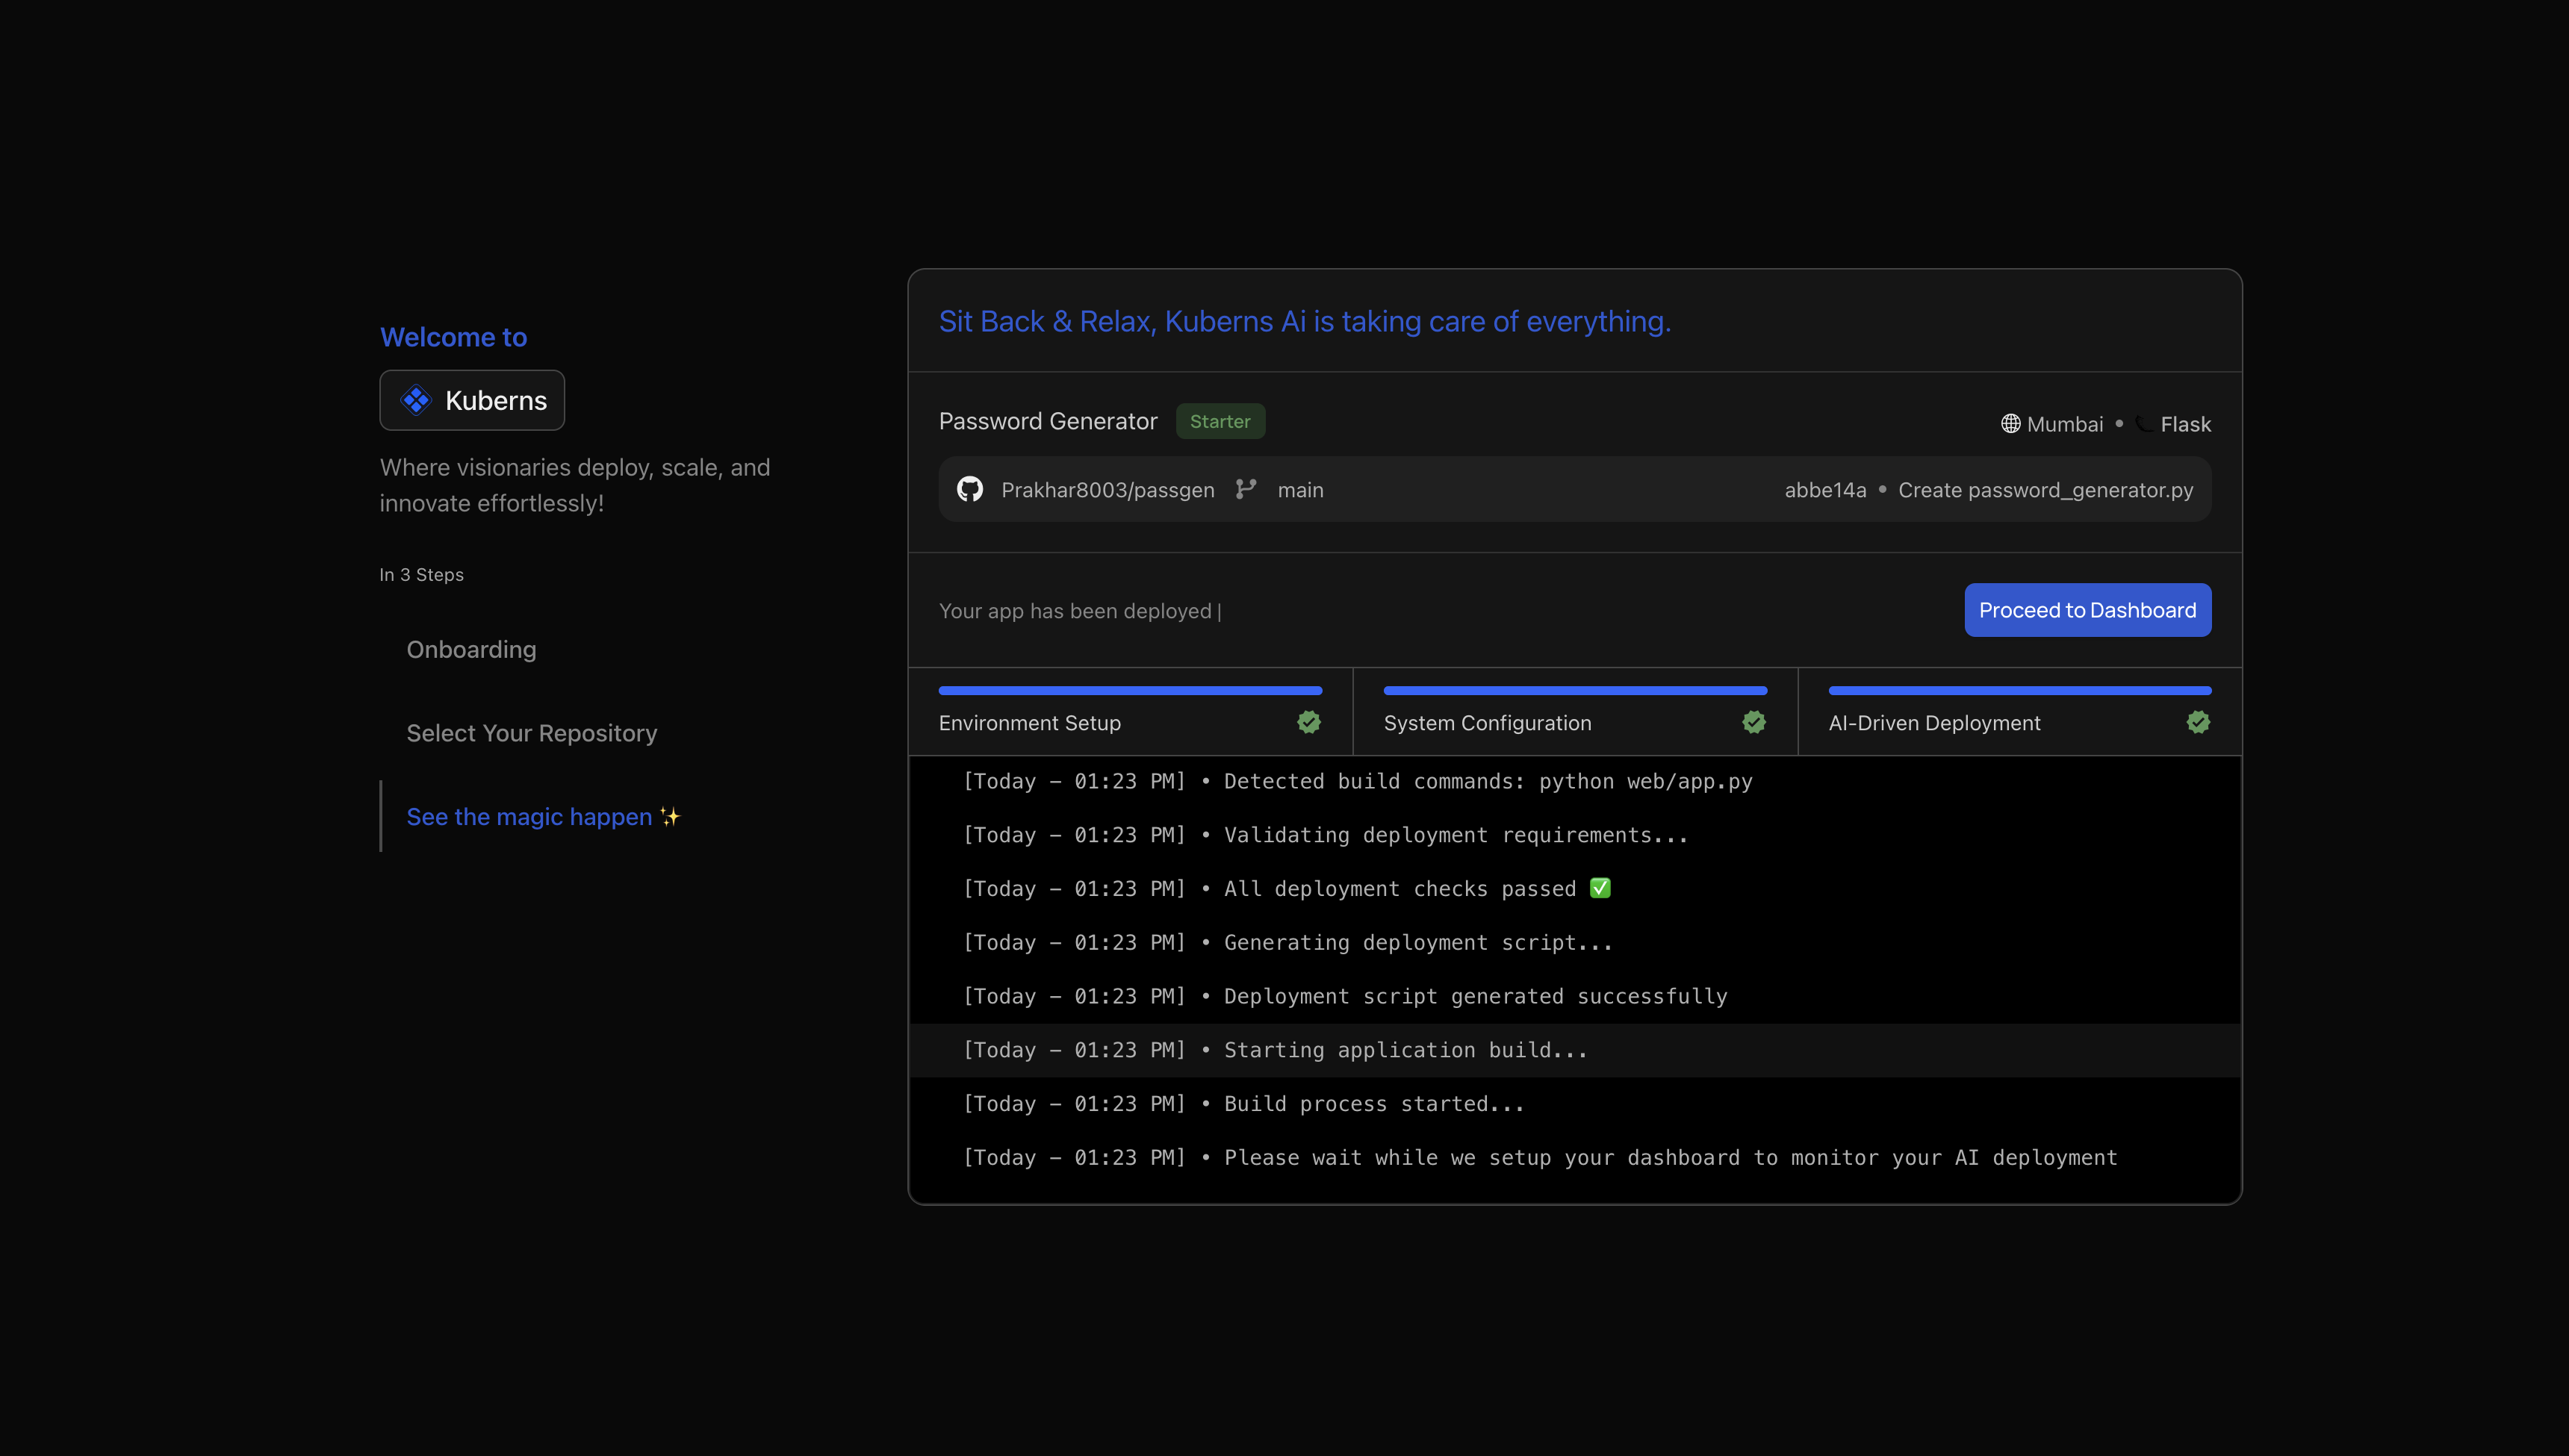
During deployment
- Start a deployment by following the steps in the Kuberns Getting Started Guide.
- While the deployment is in progress you’ll be able to see the progress and logs right on the screen.
- This section displays real-time logs as Kuberns sets up your application, including environment setup, system configuration, repository cloning, and dependency checks.
- Monitor the logs to track the deployment progress and identify any issues that may arise.
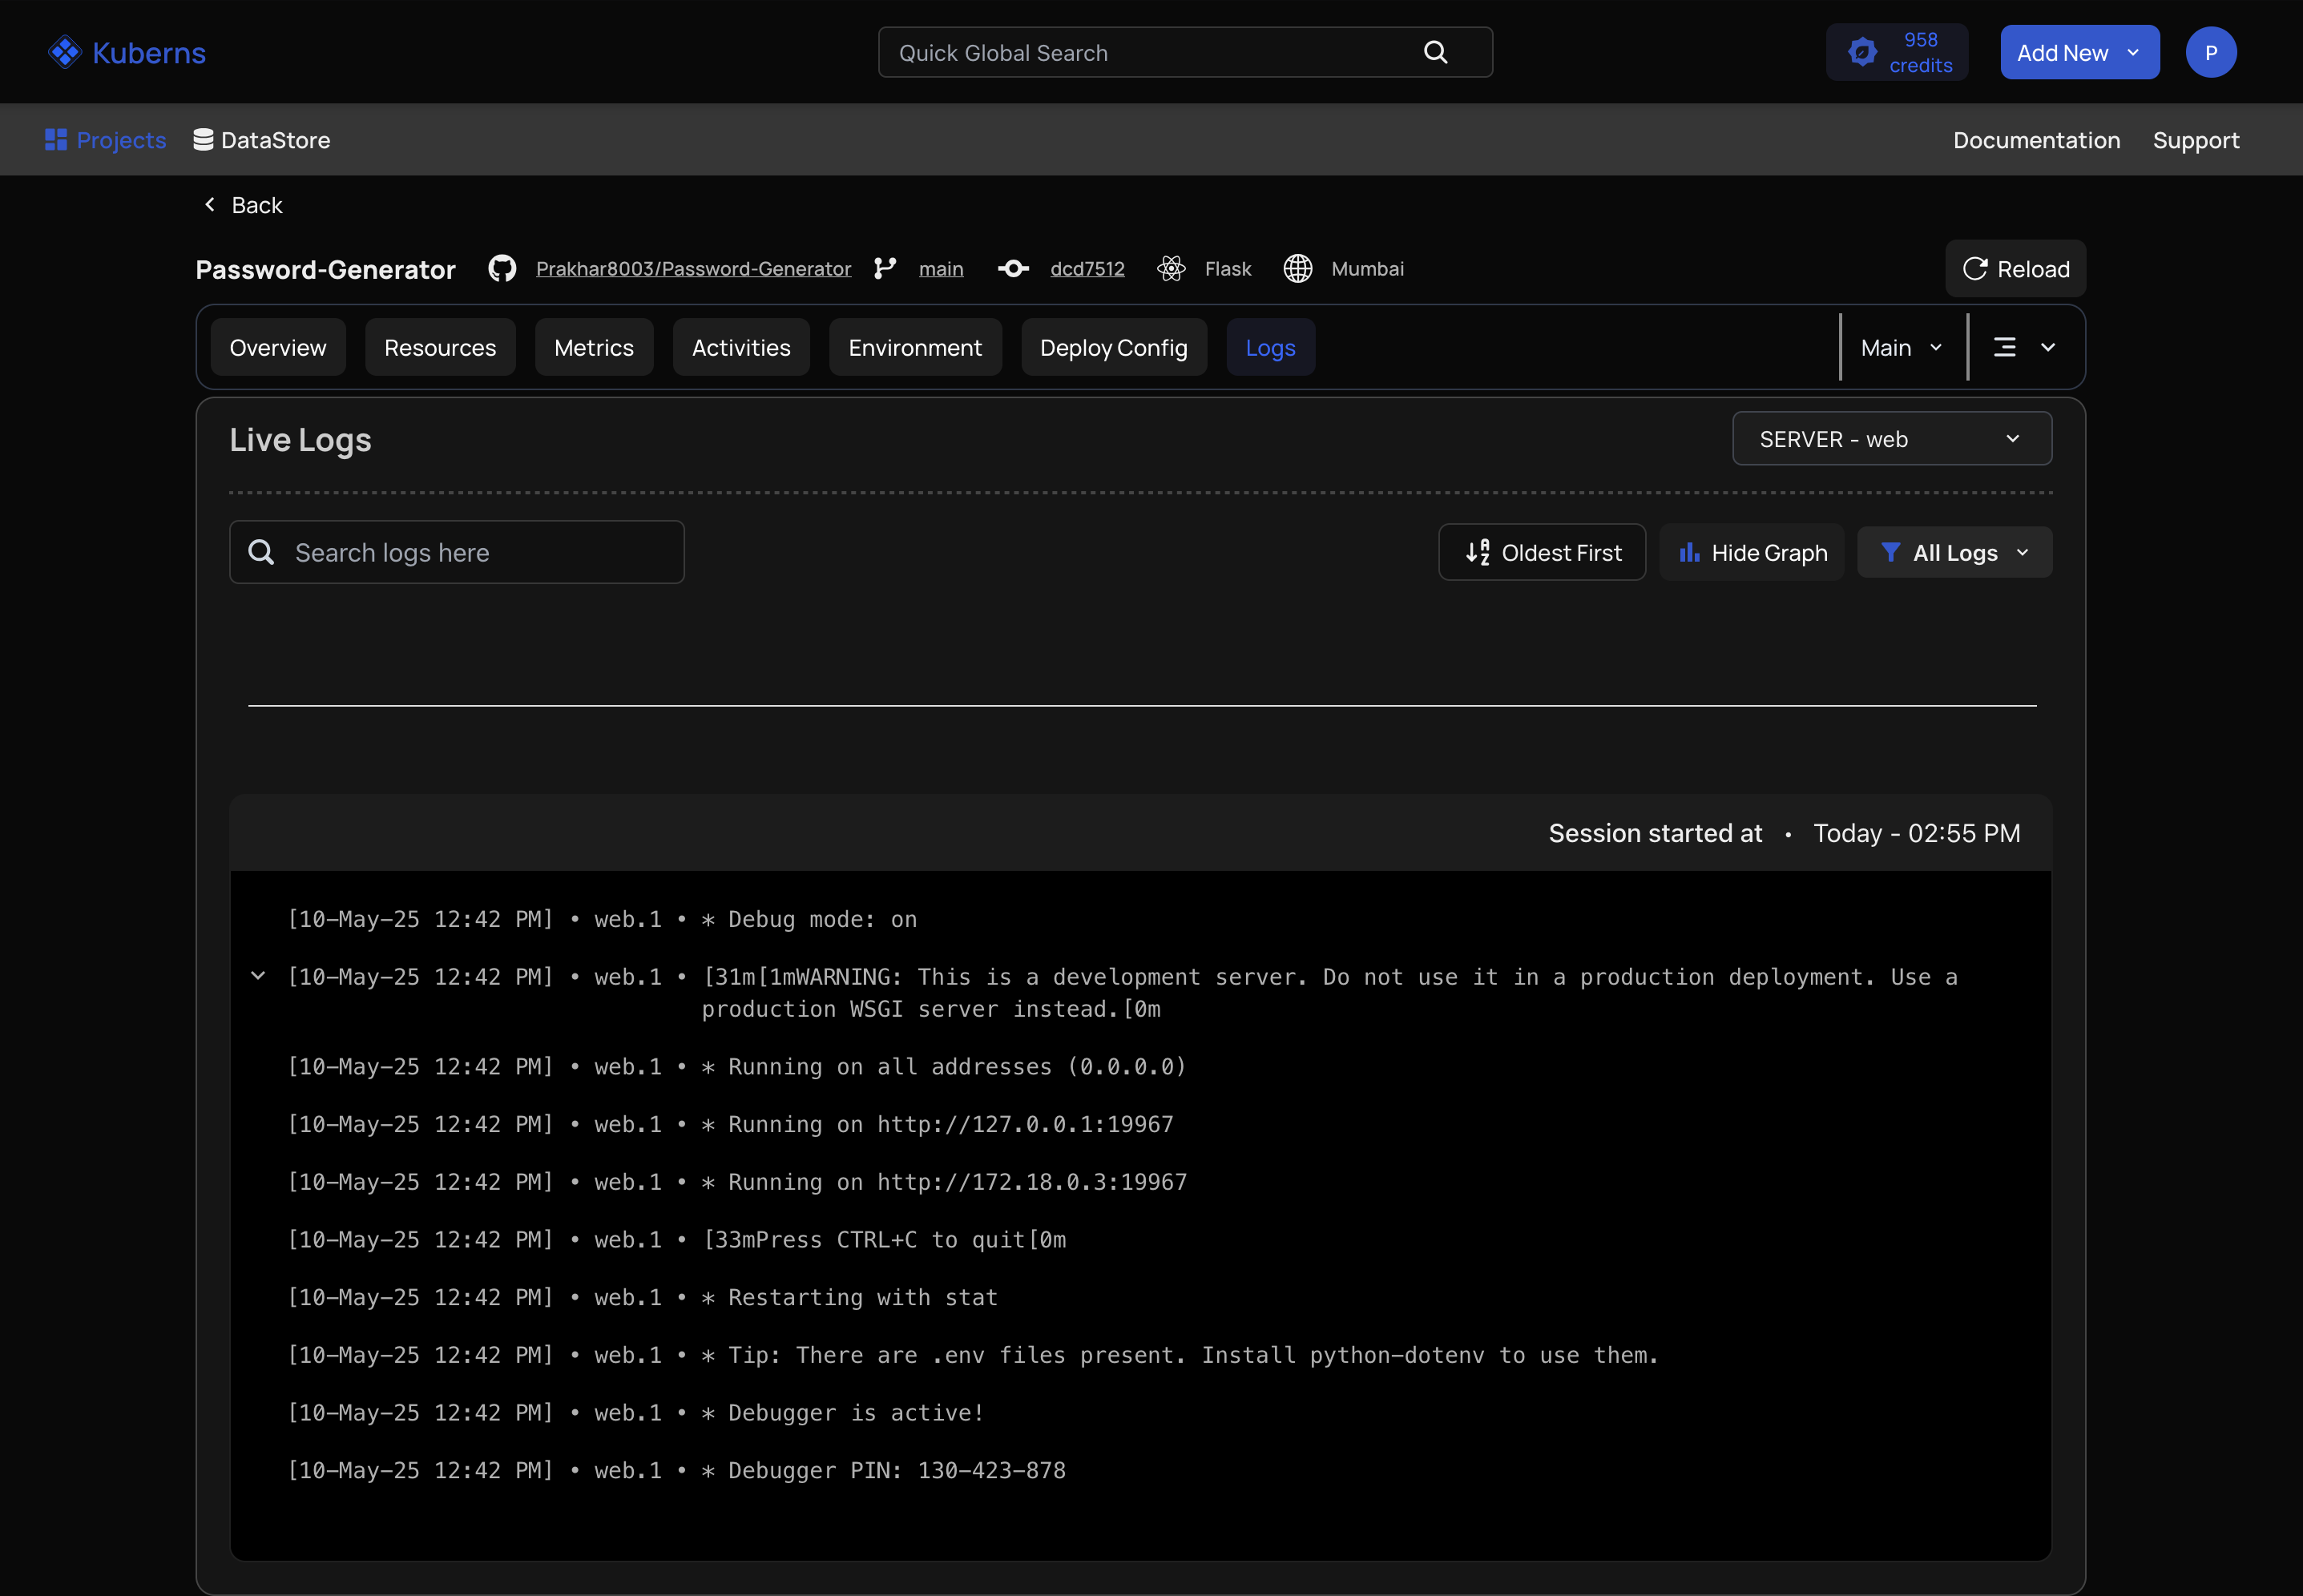
Post-Deployment
- After your application is deployed, go to the Logs section in the Kuberns Dashboard.
- This section provides a continuous stream of log data from your live application.
- View logs specific to each server within your service, including error messages, warnings, and informational messages.
- Note: The content and structure of logs may vary depending on the number of servers in your service.
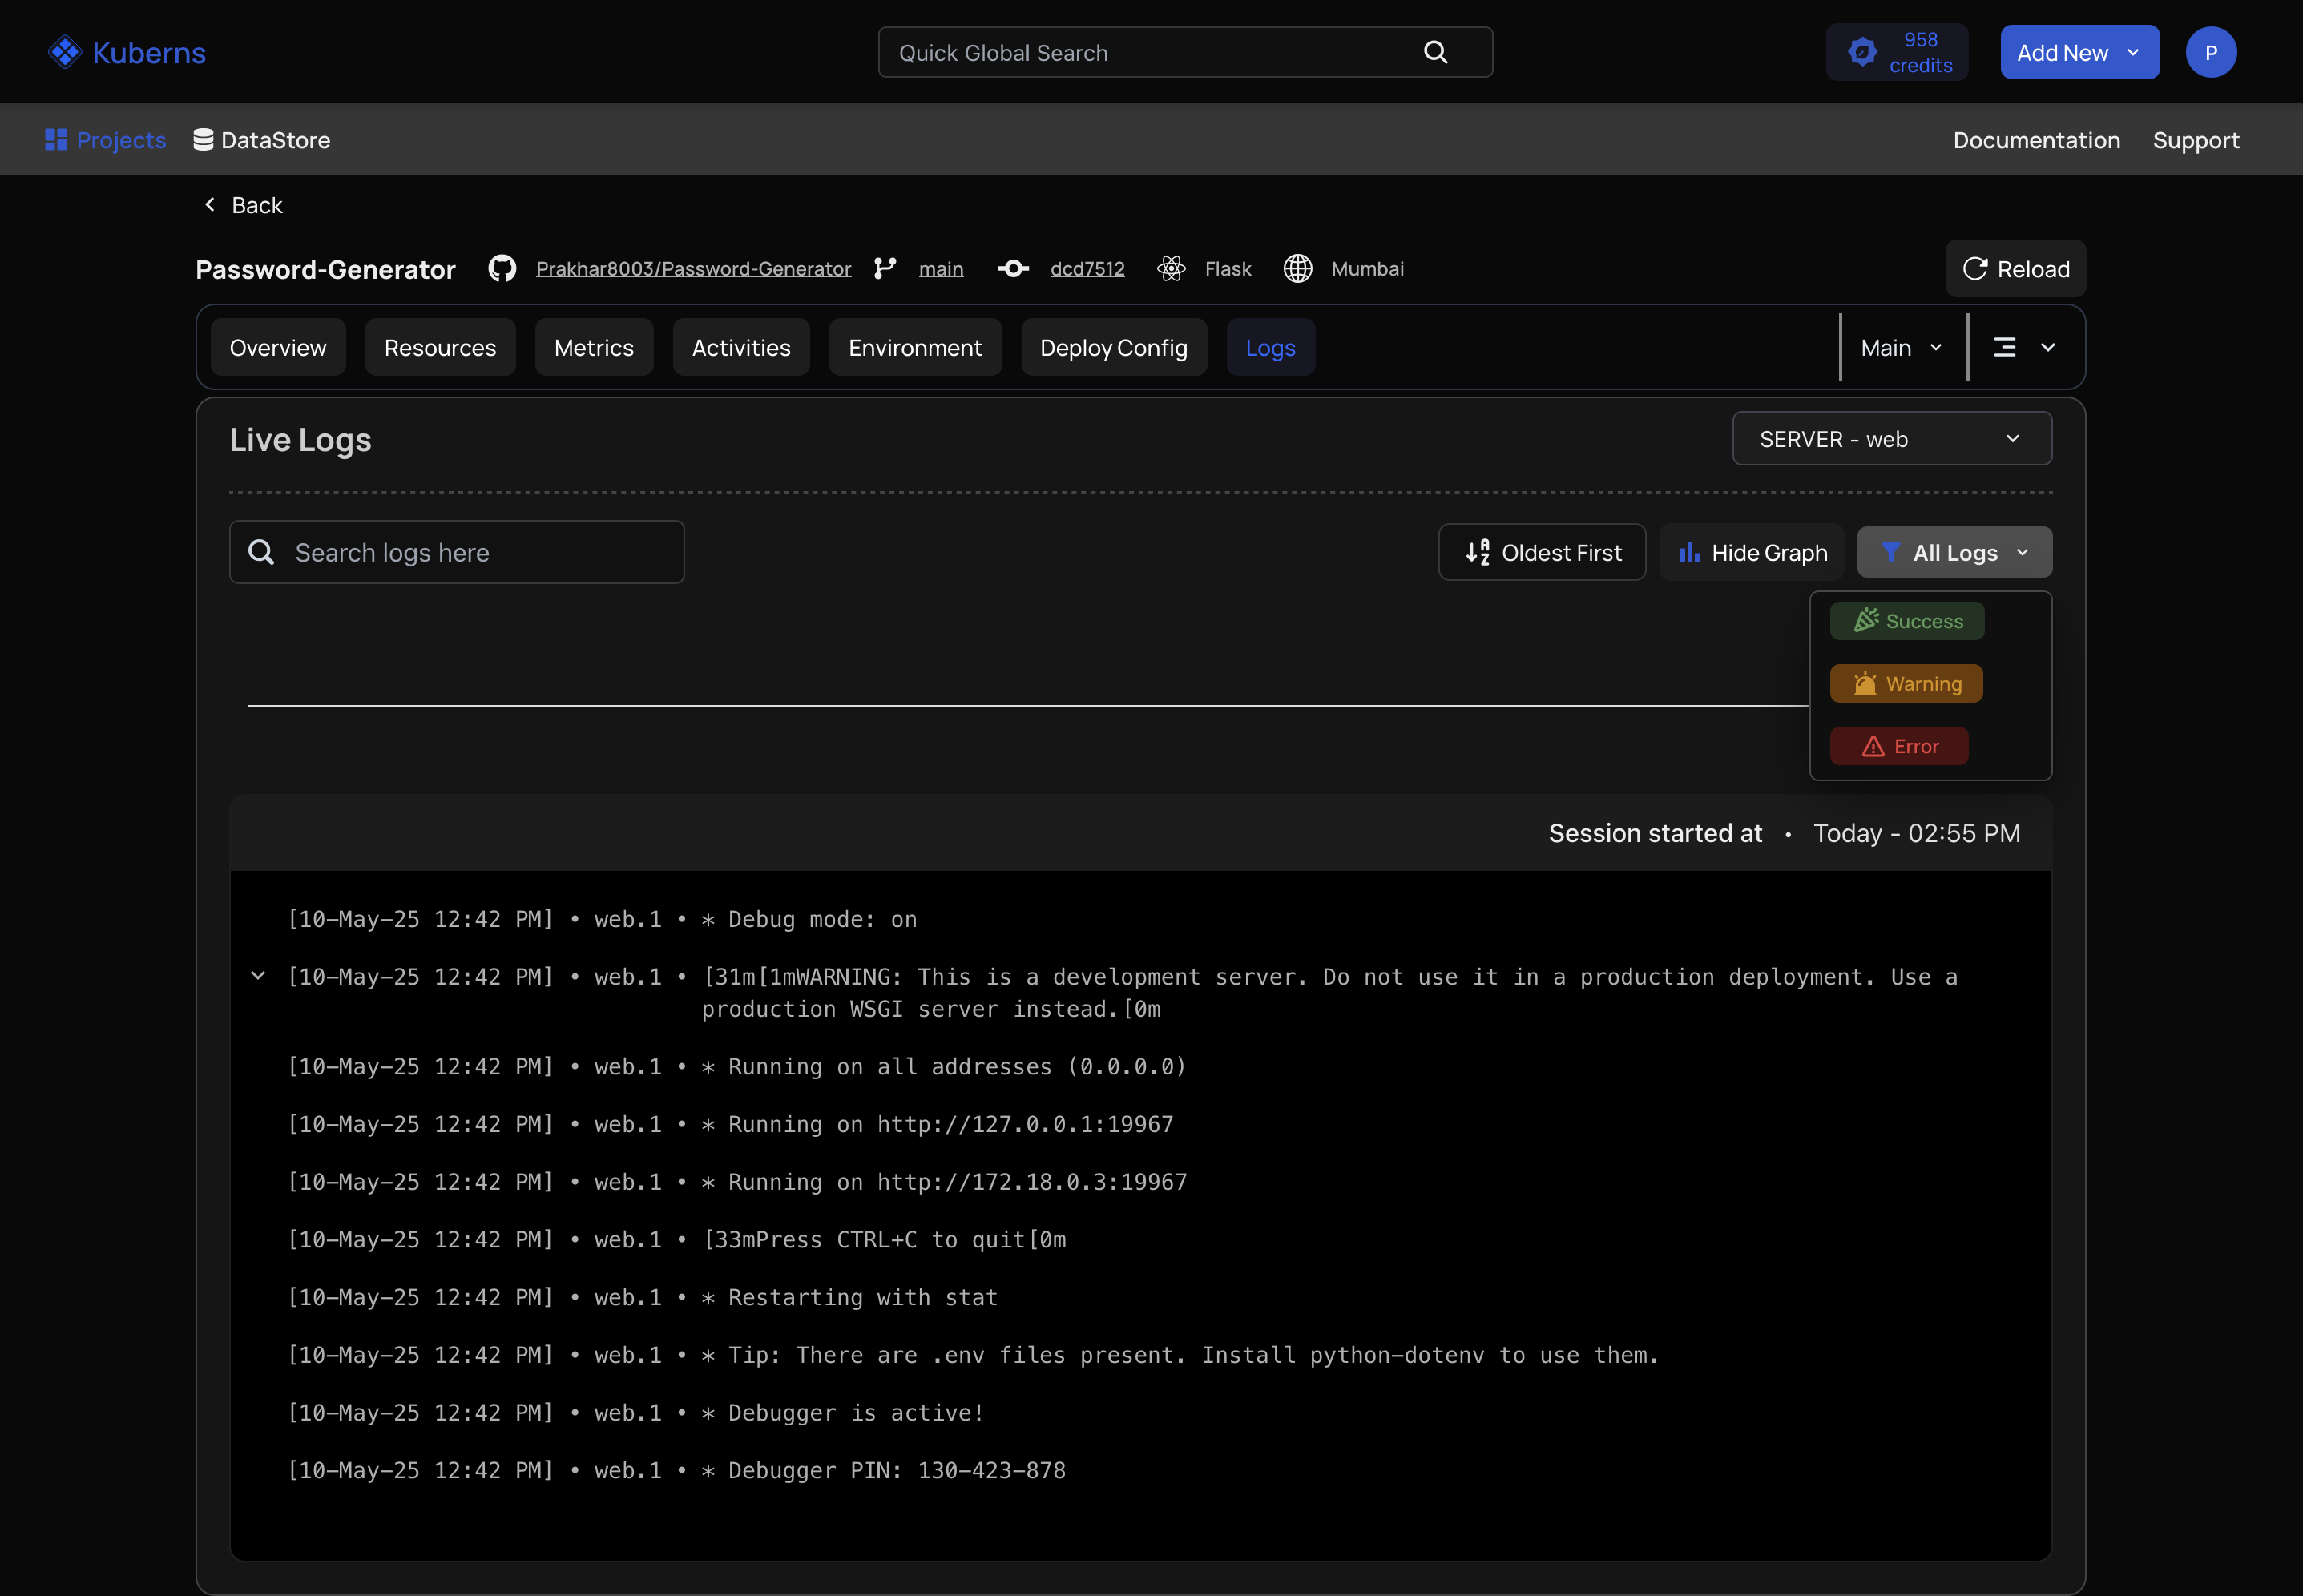
Filtering Logs
Kuberns allows you to filter logs to focus on specific information:
- In the Logs section, locate the filter options.
- Apply filters based on suitable criteria.
- Click on selection to update the log view with your filtered results.
Filtering helps you quickly pinpoint issues or analyze specific aspects of your application’s behavior.
Best practices for using logs
To make the most of Kuberns logging capabilities, follow these best practices:
- Monitor Regularly: Check logs frequently during and after deployment to stay informed about your application’s status and catch potential issues early.
- Analyze Patterns: Look for recurring patterns in the logs, such as frequent errors or performance bottlenecks, to identify areas for optimization.
- Debug Efficiently: Use filters to narrow down log data when troubleshooting, making it easier to isolate and resolve issues.
- Track Deployment Health: During deployment, monitor logs to ensure each step completes successfully, addressing any failures immediately.
By leveraging the Logs section effectively, you can maintain better visibility into your application’s operations, leading to faster issue resolution and improved reliability.